
# Report an issue
# Browser
When resolving issues/errors we need information from the browser developer tools. The browser developer tools can be opened by pressing F12 or CTRL-SHIFT-I (or via the menubar)
Errors are logged to the Console tab. Sharepoint and/or other extensions will also log items to the console. Only messages from epona are related to Epona365. See example

Errors (or wrong results) can also be caused by network errors. Each network request is logged to the network tab. To minimize the number of request activate the filter Fetch/XHR
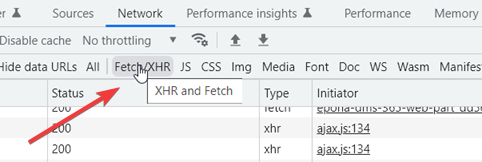
Here's an example:
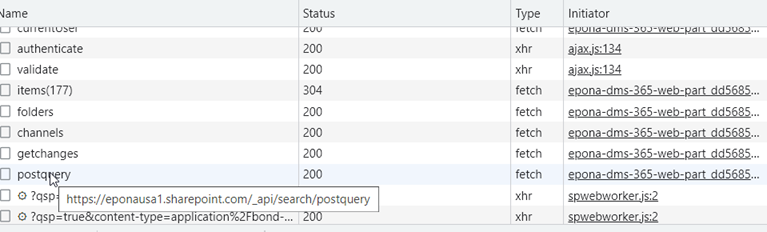
To view the details of the request click on the line. Postquery is a request to fetch results from the Sharepoint search engine.
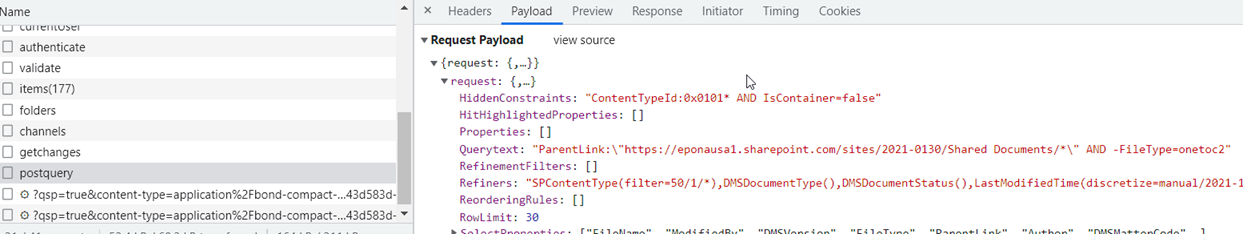
You can copy the HiddenConstraints and/or QueryText text and execute the search within Sharepoint using the normal Search user interface and validate the results (and/or tweak the query to get the correct results).
The request details can be copied via the tab Payload, right click, copy object

When reporting an issue:
- describe the steps to reproduce (including screenshots/screencast (for example using ShareX (opens new window))
- check the console tab and copy Epona365 related messages
- check the network tab and copy the Payload
# Outlook
When Epona365 Web is loaded in Outlook, Epona365 web is loaded in an embedded web browser. In Outlook class you can press F12 to show the developer console. In the New Outlook you have to run outlook in developer mode via olk.exe --devtools.
Alternatively you could load Outlook Web Access (opens new window) in the browser.
# Teams
There's no developer experience possible in the Teams desktop client. You could load Teams in the browser (opens new window) and try to debug the issue in the browser.